« Return to FMDAA entries

Department of General Services, Baltimore, Md.
CATEGORY: Financial Management
Overview
(SCI) Space Consolidation Initiative: A Multiyear Response to Increasing Facility Costs and Operational Inefficiencies
Background
Faced with critical and recurring fiscal constraints, the Department of General Services developed a Space Consolidation program resulting in cumulative savings from FY2014 through FY2016 of $1,219,721. These savings were realized by: 1) moving Agencies in privately leased spaces into, vacant City owned space and, 2) using space more efficiently by identifying underutilized space and consolidating more employees into those spaces.
Of this savings over the three fiscal years of the program $221, 072 are from cost avoidance (explained later) and $998,649 are direct savings generated by the SCI activities. The graph below shows the impact of the program on the City finances for a seven year outlay since the start of the program. While $1.2M represents cumulative savings for three fiscal years, chart 1 shows the amount that, without the action and result of the SCI, would have been spent as a fixed cost for agencies that require operating space to carry out their legal and Mayoral mandates.
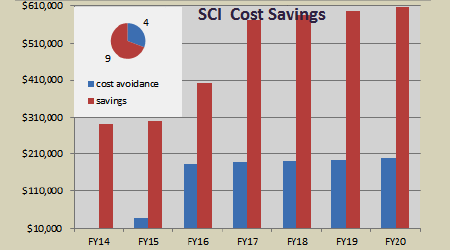 Chart 1
The above answers questions like how much will be saved in fiscal year 4 only or 5 only while providing a snapshot on the relationship between the types of projects in the program. Under the program, cost savings resulted from intentional renovation and consolidation towards a workspace standard while cost avoidance resulted from our actions to prohibit or facilitate lease renegotiation or relocation of agency operations previously in privately owned space. In determining savings we used the difference between the documented [annual occupancy cost prior to space consolidation activity] minus [new agency occupancy expense after consolidation activity] and applied a constant, conservative inflation rate of 2% as this captured the established financial liability to the City. Cumulative cost savings are determined by adding these fixed annual costs to establish the amount of General Fund dollars that can be allocated for future uses over a set period. Cost avoidance dollars represent levels for fixed costs that—barring intervention in lease negotiations or restructuring to ensure compliance with the program’s space policy—would have been realized. (Variables constituting the occupancy rates are explained in “SCI Operational Details” section.)
Constraints as Catalyst
A note on the four constraints which were the catalyst for the Facility Resource Management Space Consolidation Initiative (SCI) is required. First, historic underfunding for facility capital planning meant that without intervention the Facility Condition Index and deferred backlog would worsen while we remained unable to address capital needs with operating and maintenance resources. Second, we faced budget reductions and spending freezes in response to slowing property tax revenues and tremendous budgetary strain from police settlements and public safety overtime spending. Third, increasing square footage costs for facility maintenance. Fourth, because the Facility Maintenance Division is still making the transition to a fully internal service business model, the budget source is General Funds for a significant portion of the agencies budget. General Fund dollars are not dedicated or protected funds and therefore are frequently reduced or assigned to meet the needs of other City agencies and—by their very nature—are more susceptible to the political pressures of decision making in a densely populated urban jurisdiction.
SCI Operational Details
In 2013, to respond to the above constraints the Department of General Services established a Facilities Resource Management Unit whose charter was to develop a multi-year plan to reduce the total cost of ownership per square footage for Facility Maintenance Division managed facilities. It was comprised of an architect and space planner, a real estate officer, and the agency CFO.
Their review included analysis of historic general ledger cost data for: facility maintenance costs, rental rates, energy, chilled water and the composite square footage costs. It also included review of: current operational policies, performance data from our work order management software, review of lease agreements.
Program Development
The analysis in 2013 identified opportunities that resulted in new, multi-year operational polices and new Key Performance Indicators for tracking cost savings. Critical amongst these new practices were:
- Using the findings of a 2011 GSA study as the basis for establishing an administrative workspace policy (maximum 190 square feet per work station) for the City of Baltimore.
- Prioritization of agency space based on: lease terms and expiration dates, comparative future cost outlay of lease agreement vs City space, future revenue, potential for consolidating operations.
- Revised work plans, performance evaluations to incorporate General Services requirement to perform comprehensive space needs assessment prior to agency space moves in both City-owned and private buildings.
- Department started to perform Use & Occupancy Surveys of administrative space of City agencies because a reduction of occupied space centered on implementing a more efficient design model.
- Elimination of $1 leases where the City was responsible for all expenditures associated with a facility.
- Establishing a Department of General Services role on the City’s Space Utilization Review Committee to identify and disallow unfavorable private leases and to reinforce occupancy guidelines or size standards for new lease terms.
Establishing an evaluation criteria and system allowed the department to clearly group City agency operations into three specific groups for action—a) those in privately owned spaces with lease costs equal to or lower than the costs of City-owned space, b) agencies in spaces with rental rates less favorable than the potential use of City-owned space, c) agency operations that would benefit from established annual savings and operational efficiency from consolidation into a new or renovated space. The specific agency operations in these facilities shaped the long-term strategy and schedule of SCI activities incorporating information about lease expiration and renewal dates.
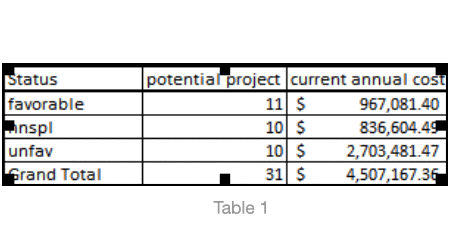
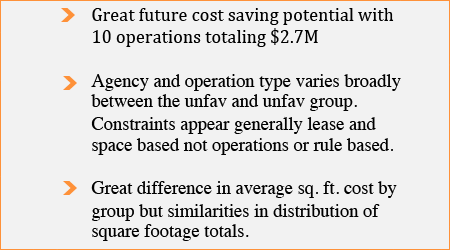
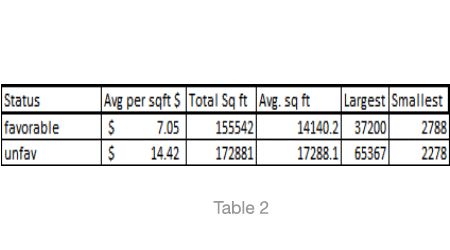
Work on projects in the first phase that produced the cumulative savings of $1.2M over 3 years was shaped by an internal, data-driven approach to identify the highest potential savings. The grouping of facility and agency projects into favorable and unfavorable buckets provided useful insights. For example, of 31 projects in phase two (FY17—FY20), the distribution—based on cost savings potential—was 11 favorable lease or space arrangements, 10 unfavorable and 10 (nnspl) “necessary neighborhood specific private leases”. Key findings that drove the program development are highlighted in below tables showing phase II projects.
SCI Program Outcomes
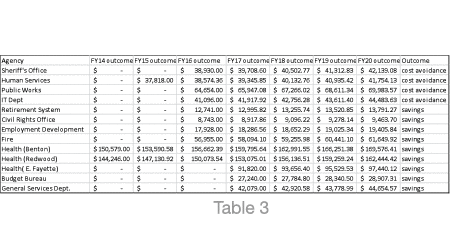
The agency operations that participated in the FY2014 to FY2016 phase range from information technology to public works to the budget bureau’s innovation lab. A table of the phase I key participating agencies and realized savings is listed below.
A good example of the impact of SCI can be seen with the Health Department savings. The Health Department relocated programs out of privately leased locations at 5610 Harford Road, 201 E. Baltimore Street, 1800 Charles Street, 1601 Baker Street, and 801 E.25th Street (FY’17) into City-owned space. As a result the City has seen a savings of over $380,000 annually. Additionally, the Health Department consolidated 4,700 sf. at the Waxter Center to create leasable space for a non-profit organization.
Other noteworthy examples include the Mayor’s Office of Employment Development (MOED) space consolidation and the Fire Department consolidation. MOED consolidated their programs in a central downtown building and vacated 2,725 sq ft saving $17,928 annually in FY’ 16. The Fire Department consolidated its administrative offices at another downtown municipal building reducing space by 8,094 sq ft saving $56,955 annually from FY16.
There were important early lessons learned about the value of communicating to agencies frequently and with expenditure data about the agency specific and citywide benefits of space consolidation. Included as attachments are the FAQ we used to facilitate conversations with agencies on space planning savings opportunities and, the 2011 GSA report “Workspace Utilization and Allocation Benchmark” which helped develop our strategy.
In addition to cost savings, there were other important outcomes for our operations. For example, the space consolidation events like that of the Fire, MOED or Health Department mean that facility maintenance resources can now be concentrated to fewer locations, reducing travel times for repairs, reductions in the total number of square footage under maintenance and a decrease in the number of facilities that must compete for limited capital maintenance resources.
Ten-Year Financial Plan for Baltimore report noted Baltimore’s aging infrastructure and new capital investments require funding well beyond identified, existing resources. While comprehensive condition assessments have not been completed for every City asset category, there is no question that much of Baltimore’s public facilities now falls short of a state of good repair. (City of Baltimore Ten-Year Financial Plan FY2013—FY2022 by Public Financial Management “http://bbmr.baltimorecity.gov/portals/bbmr/documents/TenYearPlanBackgroundReport.pdf“).
In-house Participants
Terrence Jennings, General Services Real Estate Officer
Willem Elsevier, General Services Architect & Space Planner
Steve Sharkey, General Services Director
Berke Attila, General Services Chief Fiscal Officer
Michael O’Connor, General Services Fiscal Analyst
Walter Horton, Office of Comptroller Real Estate Agent
↑ Back to top


