« Return to FMDAA entries

Anchorage (Alaska) School District
CATEGORY: Financial
Anchorage (Alaska) School District
Overview
|
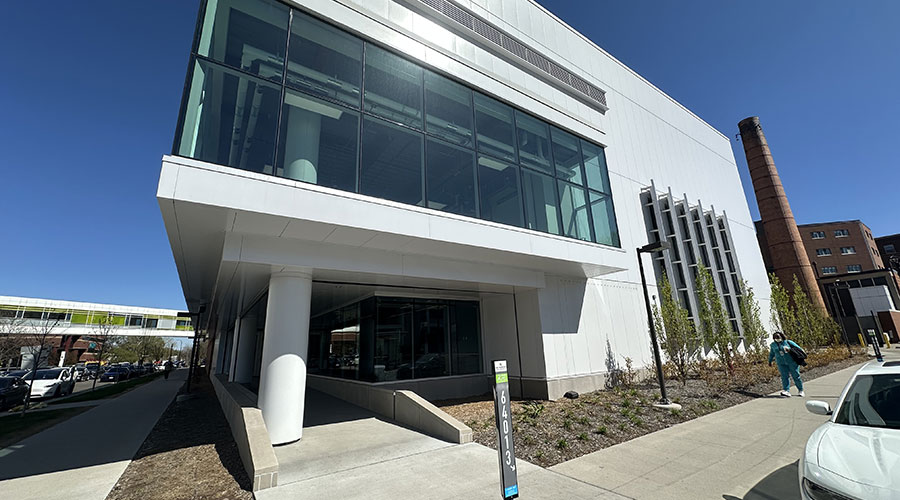
Anchorage School District (ASD) has nearly 100 facilities, 8,000,000 square feet of buildings and 49,000 students. It is ranked as the largest school district in Alaska and among the top 100 in the nation.
|
 |
When asked to prepare the 2013-14 Operations budget, Darin Hargraves, the director of Maintenance and Operations, was asked to reduce custodial employee cost by $2,000,000 and custodial supplies and equipment budgets by 20%. By developing a strategic methodology to the budget and staffing reduction process, Mr. Hargraves and his team were able to reduce the department's overall budget by 13% and still preserve a high level of cleanliness in ASD school facilities.
Key to the process was the development of Key Performance Indicators (KPIs), one of which was an in-depth assessment of current Performance Levels. Multiple surveys were conducted at each ASD facility to determine the APPA Cleaning Level score for each of three user groups: principals, teachers and Operations managers. This allowed for the assessment of perceived performance from multiple perspectives and “stake-holders.” Other KPIs assessed were: Cost-per-Square-Foot, Custodial-Workload and Cost-per-Student.
Utilizing this collected data and a computer assessment tool designed for the purpose of graphically viewing the KPI by facility, school custodial staffing was equitably reduced districtwide by 37.5 employees. This was done by norming School cleaning allocations to within a range of acceptability with consideration to school facility Cost-per-Student and other KPI as required. Cost-per-Student was utilized as a reliable indicator of the soil load in any given facility—schools at 100% student capacity had a lower cleaning Cost-per-Student and higher soil loads due to increased facility use. Facilities staffed at a lower percentage of student capacity showed a higher cleaning Cost-per-Student and demonstrated lower facility soil loads.
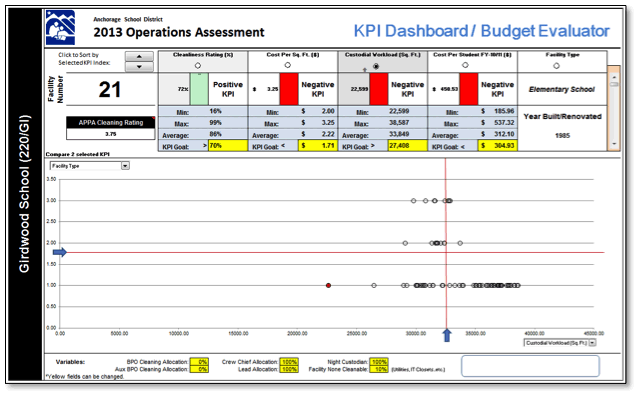
The KPI assessment tool, developed by the Operations team, had the ability to plot schools by comparing KPI into quadrants. By manipulating staffing and other variables, school KPI could be plotted and evaluated.
 |
|
In this graph, those schools above the horizontal line are considered high in cost per student; those schools to the left of the vertical line represent facilities with lower custodial workloads. In this assessment, the top-left quadrant (blue circle) represents the ASD facilities with the most opportunity for staffing adjustment.
|
Limitations to adjusting cleaning staff in each school facility were: the location of each facility in respect to available workers and other ASD facility locations (ability to share workers), and the logistics of having to staff in half (.5) FTE increments.
The tool was also able to generate a report to summarize the savings of each cost cutting scenario considered. Four cost cutting scenarios were evaluated but only three were ultimately adopted and combined into one report. This report was reflected in the budget submittal which was submitted for School Board approval.
 |
|
Girdwood (represented by the red dot) is a small school, located in a small community, 45 minutes away from other ASD school facilities. The small size of the school and the distance from other facilities makes it very difficult to adjust for more desirable KPI scores.
|
|
As a result of adhering to a strict methodology, Operations gave 110% of what was required--$2,195,110.10 in labor savings. The efforts of the Operations team saved an additional two teaching positions as a result of going the “extra mile” through prudent and equitable resource allocation.
Other Cost Saving Efforts:
The Operations department also created a resource conservation department that helps to diverted 489 tons of waste from the municipal landfill annually. These efforts offset associated hauling charges and fees, saving the district approximately $70,000.00 annually.
Day cleaning was also piloted at three schools to determine if energy savings could be realized. A survey of teachers and administrators in the school showed the program had an acceptable impact to teaching and there were savings realized through reduced electric and gas charges. The district spends nearly $15,000,000 annually on energy related utilities. Day cleaning reduce utilities costs by nearly $10,000, per school, per month.
In-house Participants
Darin Hargraves, Director of Maintenance and Operations
Bob Davis, Foreman
Additional Information
» View Operations Custodial Cleaning Schedule Survey (PDF)
» View Presentation (PowerPoint)
» View Spreadsheet (Excel)
↑ Back to top