When Reporting Figures, Pictures Worth a Thousand Words
We often hear, "A picture is worth a thousand words." Most of us don't question its truth and applicability. Except in reporting. And when we're in a hurry. When it comes to reporting, managers tend to rely heavily on written text. In "Brain Rules" by John Medina, the author highlights the way visual memory — pictures — outperforms both sentences and words for recall in memory tests.
In fact, people who were shown hundreds of photos were able to recall 90 percent of the photos three days later and up to 63 percent a year later. Pictures can more easily synthesize images quickly and retain them in their memories longer.
Consider the case of a campus facility. Several buildings were evaluated and scored based on their overall condition. The facility management department planned to use the assessment information to support a request for capital funds, as well as to understand the overall condition of buildings.
For the sake of illustration, assume the initial report showed the data in Figure 3.
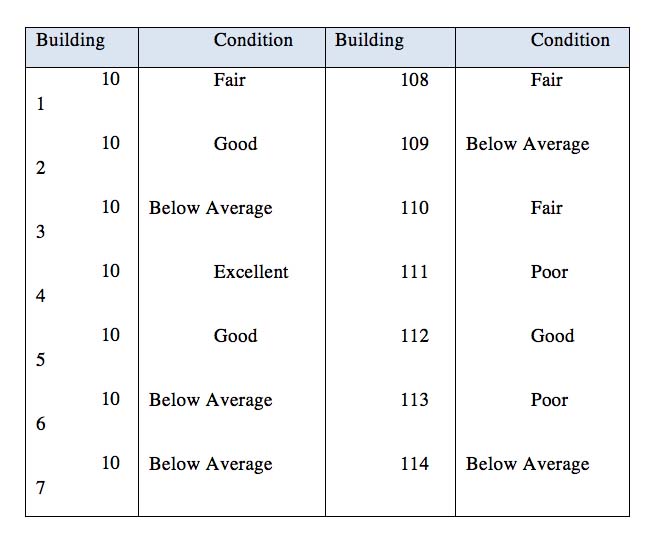
Figure 3. Facility Condition Ratings by Building
|
Without looking back at the table, which building was in the best condition? Which two or three were the worst? Unless the reader spent a lot of time processing and memorizing, it is likely they would not be able to answer very quickly and certainly not without looking at the table again.
Consider instead presenting the data using an illustration:
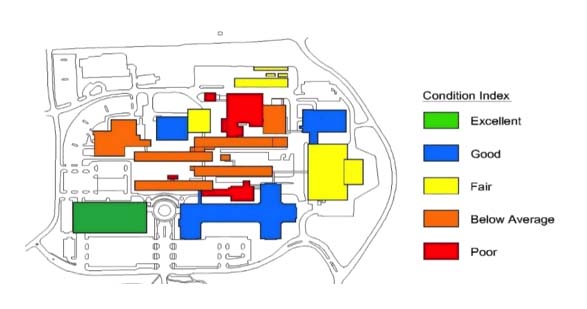
Figure 4. Facility Condition Ratings by Building
|
How many buildings are in excellent shape? How many are in poor shape? Most people find this graphic much easier to understand quickly and remember.
Using creative graphics can also convey otherwise dry information in visually interesting ways:

Figure 5. Greenhouse Gas Emissions Reduction
|
The key with this illustration is to provide an action statement that quickly links the initiative to the accomplishment.
Photographs are equally compelling, especially when they can be used to support initiatives with data. The photograph in Figure 5 was used in a waste-reduction and recycling initiative. How many items can you find that could be recycled or diverted from landfill waste? In the report, this photograph provides immediate feedback on opportunities for improvement and calls the reader to action.
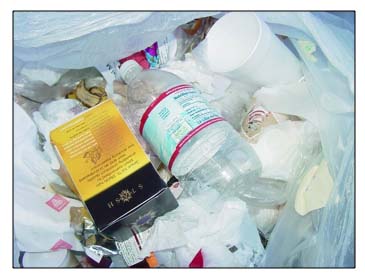
Figure 5.1. Waste Diversion Potential
|
Related Topics:


