Measuring Steady, Variable Data Center Loads Critical for Power Audits
To measure steady-load consumption, first, identify how much power a steady load consumes, then identify when the unit is on or off. If the power distribution system has breakers with electronic trip units that measure the current, take the power data from there or use a portable power meter to collect the data.
If the device is always on, or if one of two identical units is always on, there is no need to track operating status. If the device cycles on and off, use the building management system (BMS) to track operating status if it can be configured to do so. Otherwise, connect an on/off data logger to the circuit feeding the equipment to collect the data needed to measure power consumption.
Transformers, UPS systems and pumps operate at a fixed efficiency for a given load. Similarly, there are only minor electrical losses (1 percent or less) at the panels due to the passage of electricity through copper wiring. Simply map the efficiency curve or confirm the published efficiency curve of these devices before data collection.
Collect
Variable-Load Data
For each device that runs at a variable load, load data will need to be collected for a period of time, for example, every five minutes for a month, and its efficiency calculated at the various loads. If there are a number of identical devices, for example, 10 air conditioning units in a computer room, measure the variables for one and apply the data to all.
Data collection and calculations can be performed using the BMS if it can be configured to perform these tasks. If not, collect the data using portable standalone data loggers, which will automatically measure, record and date- and time-stamp the data at set intervals around the clock.
First, extract the data from the various collection tools, and put the information into a uniform format. For example, operating data collected using data loggers are downloaded to a personal computer and output into a format that can be opened using a spreadsheet program. The spreadsheet program can organize multiple data sets against the same date- and time-stamps.
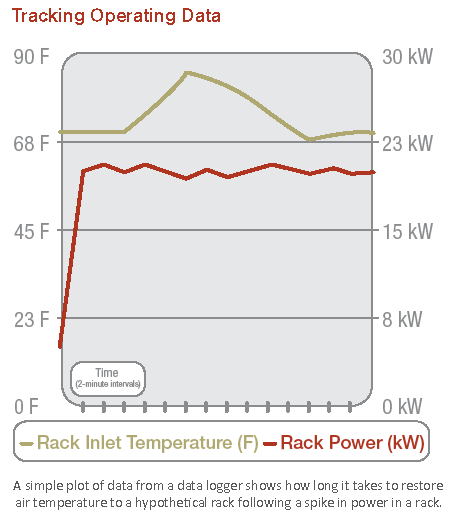
Using the spreadsheet tools, the data can be graphed to show trends over the monitoring period. (See the chart below.) The various types of equipment can be classified and their power usage shown on a pie chart, which is an easy way to identify the major power consumers.
Review the trends to identify usage patterns and opportunities for improving performance and efficiency by altering usage patterns. Plotting different data sets against IT load data can yield interesting insights into how a facility responds to changes in the IT load.
Related Topics: