N+1 Redundancy: Multiple Options
Part 2 of a 5-part article detailing the factors involved in deciding the level of redundancy for critical facilities.
For N+1 redundancy, using the same example of 100 units for the load requirement, the simple (but not always the most cost-effective) method would be to apply two 100-unit components operating together with a means for automatic disconnection of one component if it fails, or the ability to isolate one component for service. N+1 redundancy is sometimes taken further to N+2 (or more). In this example, for N+2 redundancy, three 100-unit components are used to support a 100-unit load. But this is even less cost effective than N+1 redundancy, resulting in 200 percent stranded capacity.
 More than N+1 redundancy provides minimal additional reliability unless the components have a high failure rate or require extended service downtime. But oftentimes the difference between expected load and actual load results in just that, N+2 or more. One benefit of N+2 is that, during maintenance shutdown of one unit, N+1 redundancy is maintained.
Going in the other direction for N+1, individual component ratings can be less than the load requirement if there are enough components. As an example, if the load is 100 units, three 50-unit components can provide N+1 redundancy with half the stranded capacity of two 100-unit components. Taking this idea much further, having eleven 10-unit components greatly reduces stranded capacity. However, a 10+1 system (where N = 10) has many failure modes and may actually be less reliable than an N (non-redundant) system. Five or six components is the traditional limit to N+1 systems.
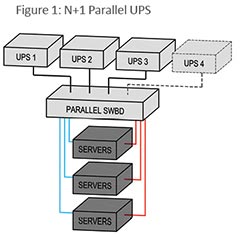
In the UPS diagram shown in Figure 1, if the total server load is 100 kW, each of three installed UPS modules needs to be rated at a minimum of 50 kW. The parallel switchboard is the single-point failure risk. One benefit with most parallel systems is that additional modules can be added in the future.
 In this example, if the total server load increases to 150 kW, a fourth 50 kW UPS module can be added to maintain redundancy. However, the drawback here is that the add-on module cannot be competitively sourced; the original equipment manufacturer can command a premium for the future upgrade.
Furthermore, a few years later the manufacturer may need to provide new equipment of older vintage, which may no longer be in full production, further driving up costs.
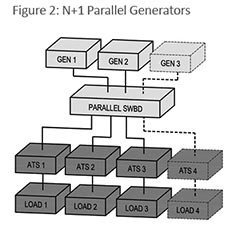
In the generator diagram shown in Figure 2, the redundancy and future load increase capability works the same way as with UPS systems. Automatic transfer switches (ATS) are shown without the normal utility input to keep the diagram very simple.
The equipment manufacturing and service industry promotes N+1 parallel redundancy configurations. Benefits include simplicity of application and operation, easier capacity matching, and easier load management. When there is only one source (the parallel system), there is only one system load to manage. Negatives include lower reliability and higher equipment and maintenance costs than 2N redundant systems (which are covered below).
Another concern is that complete N+1 UPS system maintenance requires placing the critical load on generator or directly onto utility power for many hours or more. The same concern holds for complete generator parallel system maintenance; all generators must be taken out of service.
Another item to consider is the eventual end-of-life replacement. New UPS modules will almost never work with old parallel switchgear, forcing a lengthy operation on utility power, or rental UPS equipment during complete N+1 system replacement.
FIGURES 1 & 2: Simple N+1 redundant block diagrams, one for a UPS system (Figure 1) and the other for a generator system (Figure 2). ATSs are shown without the normal utility input to keep the diagram simple.
Related Topics: