Case Study: The Power of Data in Enabling a Carbon Neutral Campus
August 19, 2021
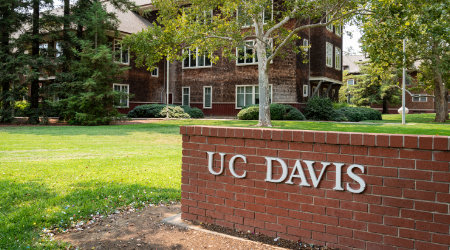
University of California, Davis (UC Davis) was the first major university to pledge carbon neutrality and set an ambitious goal of net zero greenhouse gas emissions from campus buildings and its vehicle fleet by 2025. With more than 1,000 buildings – the average age being 41 years – the UC Davis footprint reaches over 11.3 million square feet. The transformative power of data has been critical in the path to achieving their sustainability goals.
With digitally connected assets, the team can make decisions that continue to increase efficiency, reduce energy use intensity, and deliver savings. Since 2009, more than $13 million in energy savings has been realized and since 2001 energy use intensity has dropped by 54 percent.
The university’s journey started with investments in renewable energy and retrofitting large plants and buildings. After large projects were tackled, the team turned to the PI System from AVEVA, a global leader in industrial software driving digital transformation and sustainability. It enabled the university to collect data from hundreds of assets and provide historical, real-time, and predictive insights helping UC Davis keep operations running efficiently while identifying new areas for improvement.
“Getting to our 2025 goal, we need to go deeper and that increasingly requires things like use engagement, campus engagement, optimization and really in the last five years, the use of real-time data,” says David Trombly, engineering supervisor at UC Davis. He and his team have been using the PI System to track facility data since 2006. “PI has really expanded and become increasingly integral to our operations and goals.”
Three main components drive most of the energy use (and carbon emissions) for UC Davis’s buildings: steam heat, chilled water, and electricity. In the past, building and plant managers had separate systems for tracking building and plant operations. Energy use and building systems were monitored independently, and before integrating them in a single dashboard, engineers couldn’t see clearly how they were impacting each other, missing opportunities for energy savings.
Now, one of the integrated dashboards UC Davis engineers use tracks electricity rates alongside chiller electricity use and chilled water tank storage capacity. It allows plant managers to replenish a 5-million-gallon chilled water tank when rates are low and rely on stored water when rates are high. The recently launched project has yielded the university $15,000 in savings so far and Trombly said he expects the campus to save $150,000 a year from the project.
When deciding which building systems are most efficient, the answers aren’t always obvious. UC Davis has an old steam system that provides most of the heating for the campus, with some significant deferred maintenance costs on the horizon. Would it make more sense from a cost and emissions standpoint to replace boilers, or invest in a whole new system? The key to answering that question was data.
By running different scenarios with a wealth of baseline data already in the PI System, campus engineers determined that switching to a lower-temperature hot water system would save the campus money and emissions in the long run. Electricity use will go up, but the campus is looking at an expected 62 percent reduction in gas use after the switch.
“This project is going to get us a lot of the way we need to go to the goal,” Trombly said. “We’re using our PI System for improved capacity planning. Gathering all this data and baselining eventually empowers us to design our systems better. What you can’t measure, you can’t manage.”
The university’s goals are lofty, but it all starts with a simple step: gather the data.
Next
Read next on FacilitiesNet


