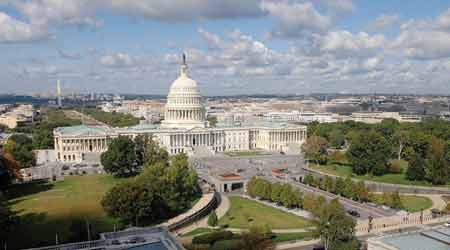
 A suite of tools helps make diagnostic and predictive analyses that aid facility managers’ decisions for the U.S. Capitol and other buildings managed by the Architect of the Capitol.Courtesy of Architect of the Capitol
Smart Buildings Success Includes Dashboards, Data Analytics, Monitoring
At the U.S. Capitol, data monitoring and analysis has led to several successes.
There’s a distinct difference between information and knowledge. Increasingly, facility managers are attempting to mine operations data about their buildings, transforming disparate information points into something that more closely resembles deep knowledge of their facilities.
The past few years have seen a surge of products and options that facility managers can use to examine, analyze, predict, and improve building performance and reduce energy costs. But connecting the dots in an increasingly complex web — the Building Internet of Things — often takes serious consideration, practical attention to budgets, and resolute effort.
Many organizations currently collect data, but want to use that data more effectively. This is the case for Texas Christian University. The university does a lot of data collection and monitoring but not a lot of data analytics, reports Chris Honkomp, assistant vice chancellor for facilities. “We have that on our list of issues to address in the next year, but are focused on installation of a new maintenance management system right now, and will address analytics as a part of this process,” he says.
Many organizations have been collecting data for years, but as prices on the software that aggregates and trends these information points comes down, more facility managers are buying into data analytics of one sort or another. Just how far any specific organization has gone depends on a range of factors, including expertise, staffing levels, available data, time, and of course budget. A look at three facility organizations shows the range of current practices and challenges.
Big data in D.C.
Imagine housing Congress and the Supreme Court — trying to keep them comfortable in their offices and chambers. Sounds like a tall task. But Dan Murphy, assistant superintendent to the Architect of the Capitol, does just that. To help keep aides and senators, clerks and justices content, Murphy and the staff at the agency use a suite of tools to make diagnostic and predictive analyses.
 Dan Murphy, assistant superintendent to the Architect of the Capitol
“We use dashboards, performance monitoring, utility monitoring, trends, survey results, and any other tool we can to assist us in serving our clients better,” says Murphy.
The agency’s CMMS dashboard displays real-time data, such as the number of open demand work orders, which the staff uses to identify trends and potential correlations. “High priority work orders that pass pre-determined thresholds for time between request and closure trigger email alerts,” Murphy notes.
Facilities staff at the agency also set “rules” for predicting problems. For example, the BAS will identify when a particular air handler has operated too much outside its standard run time. “It may be because the U.S. Congress is working late into the night,” Murphy says, “which requires extending operational hours. Nevertheless, the notification prompts us to verify that there’s a justifiable reason for the variance.” Variances happen for mechanical reasons too from time to time, as one might expect with decades-old hardware.
Data analysis has produced an array of success stories.
• Architect of the Capitol staff correlate temperature complaints from the CMMS, organized by air handler zone, thereby allowing facility managers to find air handler units with the most issues. When this happened recently, agency staff dispatched mechanics to perform a more thorough review of the equipment and found a preheat valve stuck closed, causing the discharge temperature to be too cold. As a result of this experience, all mechanical supervisors now receive an automated weekly report via email that lists temperature complaints by air handler from the previous week, Murphy says.
• Using survey data collected from occupants and workers, Murphy and his team built a spreadsheet showing temperature complaints by room. “We were able to quickly determine that there were certain areas where the majority of complaints came from,” Murphy says. “In one space, we were able to determine they were at the end of the duct line and were south facing, which created a very warm space in the summer months. We worked closely with the clients in that office to find a solution to keep them cool.”
• In January of 2014, a higher than expected chiller water flow was noted in one building. Facility staff identified some legacy equipment that had not been upgraded to DDC — they were all still pneumatic — and their valves had stuck open. “The temperature had dropped, but the valves could not close,” Murphy says. “We were able to manually lock them out, reducing the flow by half.”
The Architect of the Capitol is currently piloting fault-detection and diagnostics (FDD). It’s a challenging project. Many of the building systems are decades old, and not all hardware is tied to the BAS, so the agency doesn’t have the kind of comprehensive data needed for an FDD system. “For example, while our air handlers are on BAS, and we have wireless sensors in the various tenant spaces, the thermostats control radiators or reheats, which are not tied to BAS,” Murphy says. “Therefore, determining simultaneous heating and cooling can be difficult.”
Related Topics: